About our service
Who is this service for..?
Social Media activity and sentiment have been particularly relevant in influencing cryptocurrency prices. When high profile personalities and influencers in the cryptocurrency arena post on social media we can often see significant price fluctuations. By signing up to our service you can track when various currencies are getting social media attention and receive notification alerts to your phone / trading bot / website etc.
For more info on what we do, how we do it and why it will be particularly useful to you, continue reading...
What we measure and why
We measure social media activity, sentiment and price for cryptocurrienies. At each point we also calculate and record the mean and standard deviation for both activity and sentiment. This information enables you to set up intelligent notification and webhook rules that will send an alert to your mobile or a signal to a trading bot or website.
But what is the mean and standard deviation used for and why is it useful..?
In short it allows us to measure how significant changes are.
To understand how this is applied you first need to understand what a normal distribution is and and how the standard deviation is relevant. It sounds complicated but it's actually quite simple..!
Normal Distribution
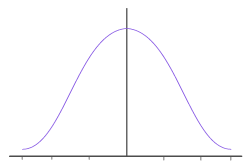
A normal distribution is used to describe a set of data whereby the bulk of the data converges around a central point. This point will be the mean or average denoted in mathematics by the symbol µ. In graphical format this will look like a bell curve with the mean falling at the highest point where the central line lies.
One example of this would be for students that sit a state exam. The bulk of students will score the average C grade, while smaller numbers of students will score a B or a D and an even smaller number will score an A or an F.
Another example would be the height of a countrys female population. The central point or average would be around 5 5" with the numbers of taller and smaller tapering of at either side of the curve.
Both cryptocurrency social activity and sentiment adhere to this distribution pattern
Standard Deviation (σ)
The Standard Deviation (σ) is a measure of how values in a set are spread out from the average or mean (µ) of that set.
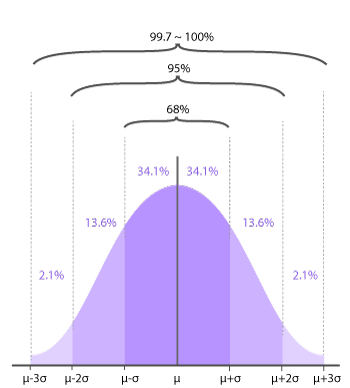
In the next graph below, the mean +/- the standard deviation is represented by the area in the darkest shade. Once we know the mean and standard deviation we can calculate what is known as the Three Sigma Rule.
Three Sigma Rule
The Three Sigma Rule is defined as follows
- A distance of one standard deviation (σ) either side of the mean will cover approximately 68% of all the values in the data set.
- A distance of two the times standard deviations (2σ) either side of the mean will cover approximately 95% of all the values in the data set.
- A distance of three times the standard deviation (3σ) either side of the mean will cover approximately 97.5% of all the values in the data set.
This is a very useful way to determine the significance of a data point in relation to all other data in the set and is how we measure social media activity and sentiment significance.
Three Sigma Rule
- The mean +/- one standard deviation => 68%
- The mean +/- two standard deviations => 95%
- The mean +/- three standard deviations => 99.7%
Our Graphs
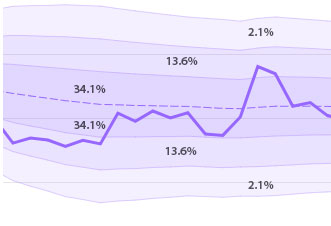
For each cryptocurrency we record social media activity, sentiment score and price at each point in time. The mean and standard deviation are then calculated across all data recorded for that cryptocurrency. You will see the mean (dashed line) and 3 shaded bands which denote 1,2 and 3 standard deviations (Three Sigma Rule).
When the social media activity or sentiment moves from one standard deviation band to another we now have a measure of how significant this move is.
ie. if sentiment moves into the third sigma (σ) band above the mean (µ + 3σ -> the top lightest shade) then we know this value is in the top 2.1% of all sentiment values recorded. Thus we now have a measure of how significant this move is. This information could help you form a position in relation to making or disposing of an investment.
Notification and WebHook Rules
You can setup intelligent rules to send notifications to your mobile phone, or to post events to a webhook on your trading bot/website etc.. Rules are based on either the activity or sentiment moving between standard deviation bands. They are triggered immediately once the event occurs.
Rules will fall into one of the following 3 categories
- sentiment/activity moves above or below a std band
- sentiment/activity moves up from one std band to a greater std band
- sentiment/activity moves down from one std band to a lower std band
In order to receive Notifications to your mobile phone, we have integrated with the Pushover app which you must first download and install. Note. There is a small once off fee
Ignoring Social Media Bots
Many of the tweets and facebook posts today are done by automated software or bots. In many instances this is a very useful facility but when it comes to analyzing social media data to gauge cryptocurrency sentiment we prefer to ignore this. Otherwise if someone automates a tweet every 5 minutes saying "Bitcoin is a great investment right now" then this would influence our sentiment score, even if the price is in decline. It is not reflective of what the true sentiment is.
Facebook and twitter have been clamping down on bots so their influence is likely to decline but right now they still make up a significant proportion of social media activity in relation to cryptocurrencies.
We analyze every piece of social media content to determine if it comes from a bot and if so we disregard it. This gives us a much better overall reflection of true social media activity and sentiment.